Or to victory!
I haven’t discussed the independence referendum opinion polls for a long time, mainly because they haven’t shown a clear picture.

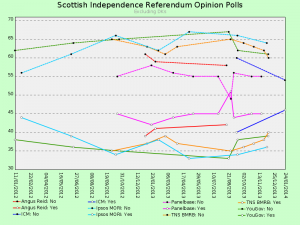
At a first glance, the picture isn’t very clear. Some pollsters are showing a strong movement — for instance, TNS BMRB is showing an enormous fall in the number of No voters since early 2013 — but it’s hard to spot a uniform pattern.

Very broadly speaking, it does look like Ipsos MORI, TNS BMRB and YouGov are in agreement, just as Angus Reid and ICM seem to concur, and Panelbase appears to be on its own. There’s no way to conclude at this stage who’s right and who’s wrong (we won’t know until the day after the referendum), but the gap between the first group and the second one is about six percentage points, and the gap between the second one and the third one is about three points.

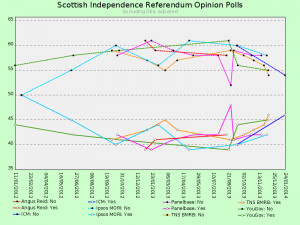
When displayed like this, it becomes very clear that the support for the No side seems to have peaked around the summer of 2013, and that Yes has been rising ever since.
If we were to draw a trend line through the results since August 2013, these adjusted figures would lead us to expect a very respectable Yes victory (55% to 45%), and Yes should overtake No in polls adjusted this way around mid May (the trend line isn’t shown on the graph).
On the other hand, if we adjust Panelbase, Angus Reid and ICM to force them into line with Ipsos MORI, TNS BMRB and YouGov, the trend line leads to the conclusion that Yes will lose by a bawhair (49% to 51%).
And finally, if we adjust all the other polls to bring them into line with Panelbase, it looks like Yes will win by a landslide (58% to 42%) and that Yes will overtake No as early as late February.
To summarise, if Ipsos MORI, TNS BMRB and YouGov are right about the proportion of Yes voters, we should expect a very close referendum result if the current trends continue; if ICM and Angus Reid are right, we’ll see a solid Yes victory; and if Panelbase are right, we’ll get a Yes landslide.
There’s a lot of work still to be done for the Yes side, but it’s very clear why the No campaign is starting to panic.
New blog post about the #indyref opinion polls: Or to victory! http://t.co/skvVgmAhvl http://t.co/0tJIXZl52A
RT @arcofprosperity: New blog post about the #indyref opinion polls: Or to victory! http://t.co/skvVgmAhvl http://t.co/0tJIXZl52A
RT @arcofprosperity: New blog post about the #indyref opinion polls: Or to victory! http://t.co/skvVgmAhvl http://t.co/0tJIXZl52A
@arcofprosperity worked up my own version, which I will be keeping updated, here http://t.co/r0es5VizZz
Excellent blog by @arcofprosperity on #indyref polls and where they are headed: http://t.co/JAt0F08ycr
@arcofprosperity I used slightly different data but same result – a turning point around August/September 2013
RT @arcofprosperity: New blog post about the #indyref opinion polls: Or to victory! http://t.co/skvVgmAhvl http://t.co/0tJIXZl52A
RT @_mozza_: Excellent blog by @arcofprosperity on #indyref polls and where they are headed: http://t.co/JAt0F08ycr
RT @_mozza_: Excellent blog by @arcofprosperity on #indyref polls and where they are headed: http://t.co/JAt0F08ycr
RT @arcofprosperity: New blog post about the #indyref opinion polls: Or to victory! http://t.co/skvVgmAhvl http://t.co/0tJIXZl52A
RT @_mozza_: Excellent blog by @arcofprosperity on #indyref polls and where they are headed: http://t.co/JAt0F08ycr
RT @arcofprosperity: New blog post about the #indyref opinion polls: Or to victory! http://t.co/skvVgmAhvl http://t.co/0tJIXZl52A
Michael Hance liked this on Facebook.
RT @arcofprosperity: New blog post: Or to victory! http://t.co/N2Rpf844jq #indyref
RT @arcofprosperity: New blog post about the #indyref opinion polls: Or to victory! http://t.co/skvVgmAhvl http://t.co/0tJIXZl52A
RT @_mozza_: Excellent blog by @arcofprosperity on #indyref polls and where they are headed: http://t.co/JAt0F08ycr
Great analysis, Tam. Very encouraging data.
RT @YesBoness: Great analysis of the opinion polls showing No peaking last summer and trends pointing to a Yes victory in… http://t.co/rK…
RT @YesBoness: Great analysis of the opinion polls showing No peaking last summer and trends pointing to a Yes victory in… http://t.co/rK…
RT @YesBoness: Great analysis of the opinion polls showing No peaking last summer and trends pointing to a Yes victory in… http://t.co/rK…
RT @YesBoness: Great analysis of the opinion polls showing No peaking last summer and trends pointing to a Yes victory in… http://t.co/rK…
RT @YesBoness: Great analysis of the opinion polls showing No peaking last summer and trends pointing to a Yes victory in… http://t.co/rK…
RT @YesBoness: Great analysis of the opinion polls showing No peaking last summer and trends pointing to a Yes victory in… http://t.co/rK…
RT @YesBoness: Great analysis of the opinion polls showing No peaking last summer and trends pointing to a Yes victory in… http://t.co/rK…
RT @arcofprosperity: New blog post about the #indyref opinion polls: Or to victory! http://t.co/skvVgmAhvl http://t.co/0tJIXZl52A
RT @arcofprosperity: New blog post about the #indyref opinion polls: Or to victory! http://t.co/skvVgmAhvl http://t.co/0tJIXZl52A
RT @arcofprosperity: New blog post about the #indyref opinion polls: Or to victory! http://t.co/skvVgmAhvl http://t.co/0tJIXZl52A
RT @arcofprosperity: New blog post about the #indyref opinion polls: Or to victory! http://t.co/skvVgmAhvl http://t.co/0tJIXZl52A
Or to victory! | Arc of Prosperity http://t.co/euiSceRmyA
Here’s a graph with new TNS BMRB poll (compare the middle graph in this blog post: http://t.co/skvVgmAhvl) #indyref http://t.co/dEBU4SrBeE
RT @arcofprosperity: Here’s a graph with new TNS BMRB poll (compare the middle graph in this blog post: http://t.co/skvVgmAhvl) #indyref ht…
RT @arcofprosperity: Here’s a graph with new TNS BMRB poll (compare the middle graph in this blog post: http://t.co/skvVgmAhvl) #indyref ht…